Is your Rails app slow?
When it takes seconds to load what should be a simple view, you have a problem worth digging into.
You could have too many database calls or some slow methods. Or maybe it’s that speedup loop someone put in your code and forgot about.
You can find lots of tools to help you find out what’s slowing your app down. A few weeks ago, I talked about rbtrace. New Relic’s rpm gem has also helped me speed up my apps.
But my favorite tool for exploring performance problems does a lot more. Out of the box, it shows you what your code is doing. But when you add a plugin to it, it becomes even more powerful. It helps you see your app’s performance problems, visually. And that can help you find and fix slow apps, faster.
My favorite Rails profiler
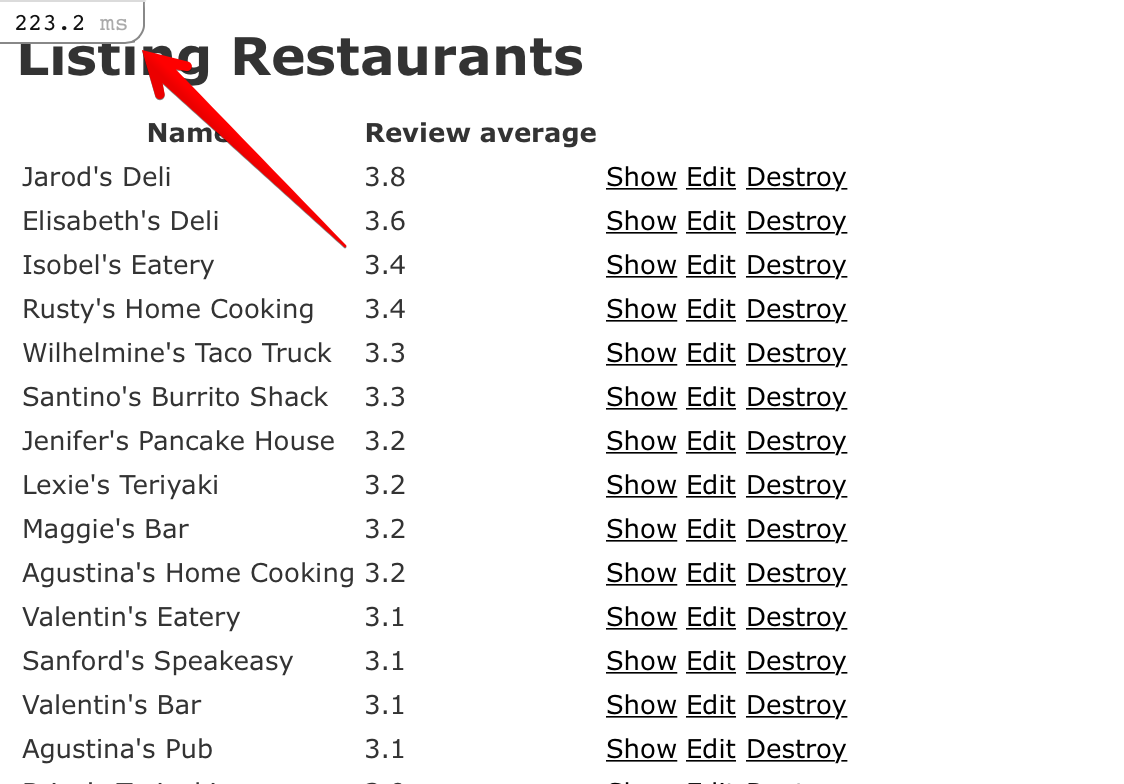
My favorite Rails performance tool is called rack-mini-profiler. When you add that gem into your app, you get a little indicator on each of your pages. It looks like this:
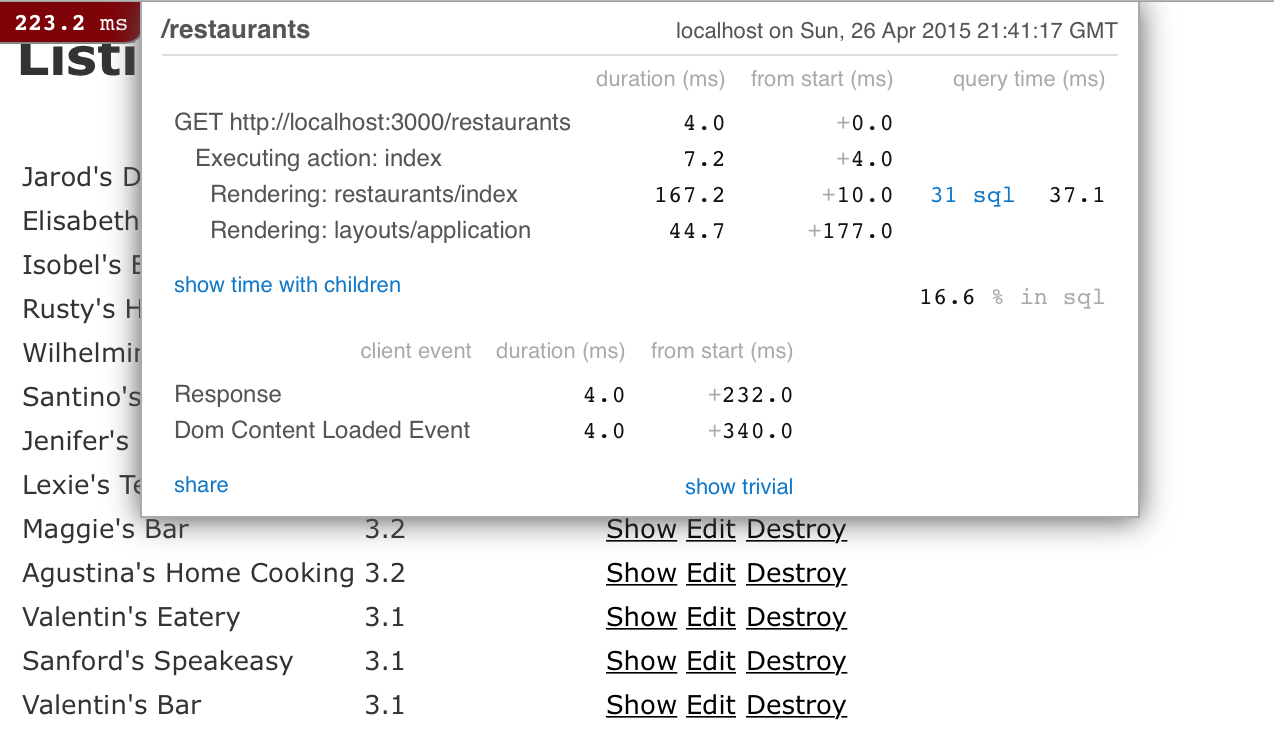
If you click on that box, it expands and you can see all kinds of great stuff. Which SQL statements were run, how long it took to render partials, and more:
MiniProfiler gives you a constant reminder of how long each page takes to load. That helps you learn more about how your app is performing. You’ll build an intuitive sense of which pages are slow, and which ones are fast. You’ll start to notice when a page takes surprisingly long to render. And you can start fixing it right away, while it’s still on your mind.
MiniProfiler can do more. But first, you’ll have to install the flamegraph gem.
When you do that, you’ll unlock a new way to see your app’s performance.
Flamegraphs: exactly as fun as they sound
A flamegraph looks like this:
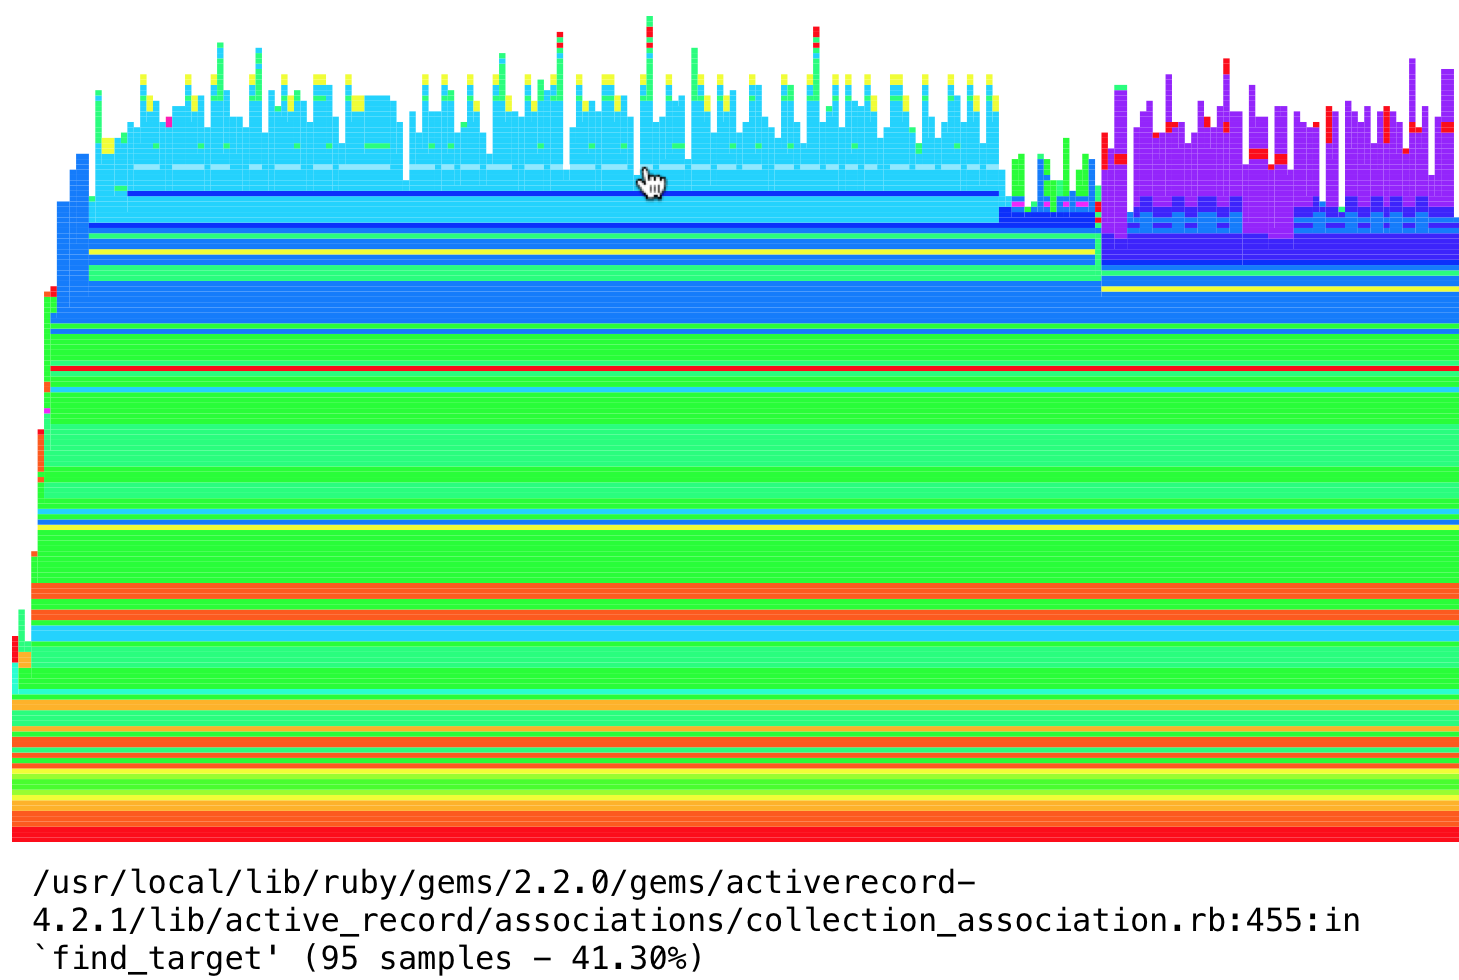
Pretty clear where the name comes from, right?
After you install the rack-mini-profiler gem and the flamegraph gem, you can see a flamegraph for any of your requests. Just add pp=flamegraph as an HTTP parameter, which would look like this:
http://www.example.com/restaurants?pp=flamegraph
The flamegraph will pop up, and you can zoom in and out, scroll around, and try to find interesting things to explore.
Each “layer” in the flamegraph is one line in a stack trace:
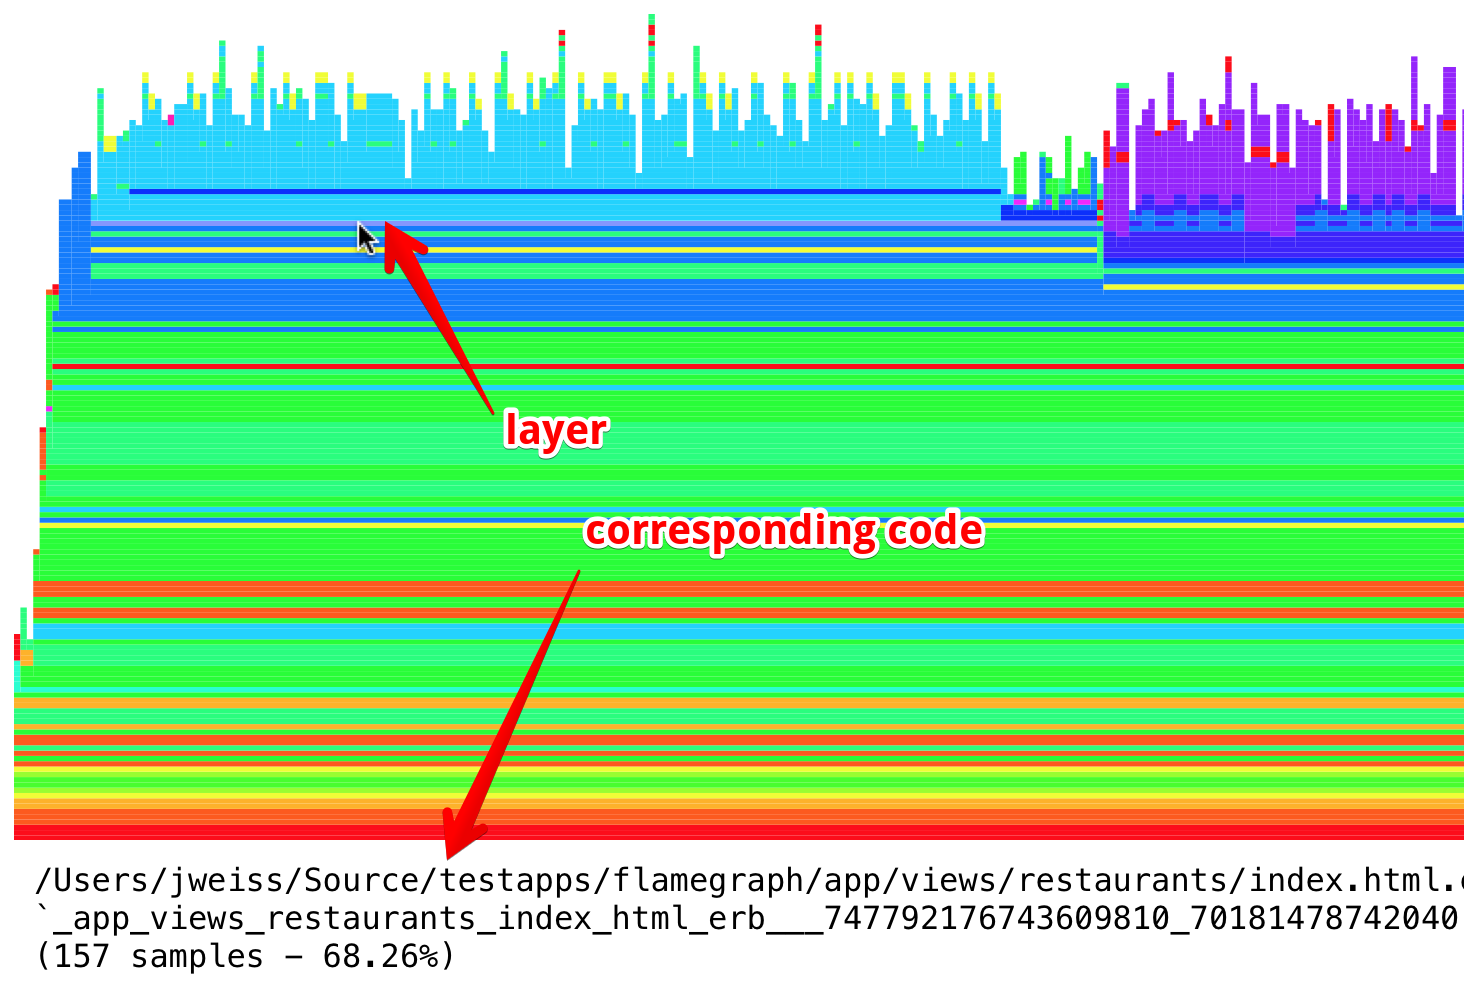
And the horizontal axis is time. So the far left side of the graph is when your request started, and the far right side is when the request finished.
So, it certainly looks cool. But what can you do with a flamegraph?
How to use a flamegraph
Because the X axis represents time, you can really get a clear picture of where your app’s getting bogged down. The widest layers take the longest to run. They’re the first areas you should look into, because speeding them up could have the biggest impact.
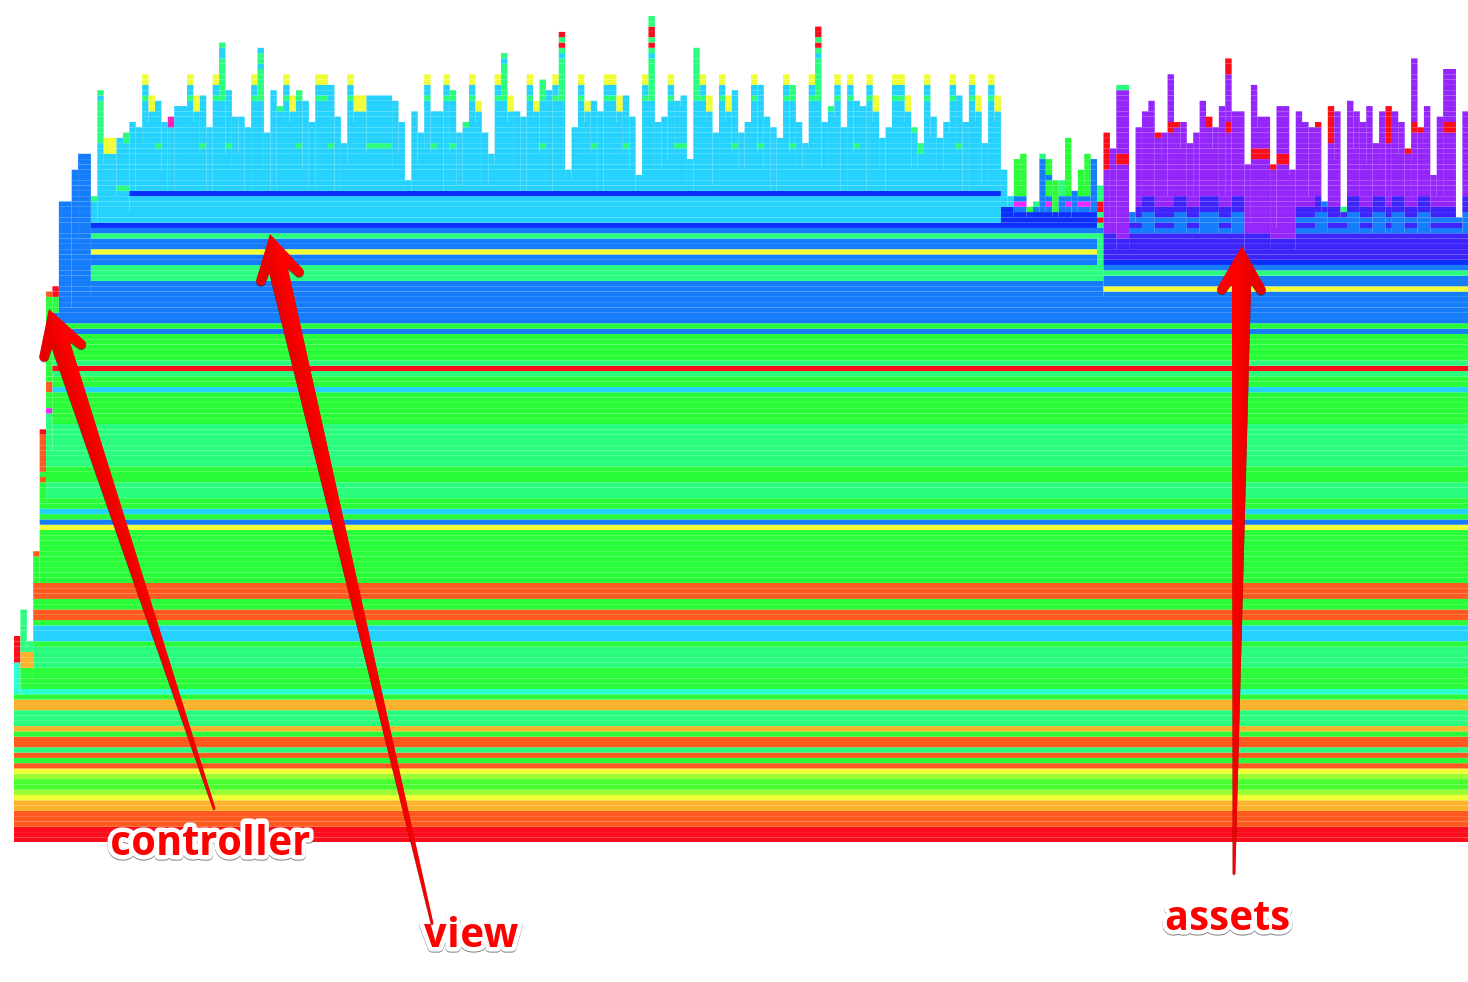
How much time is your app spending rendering your view? In the controller action? Hitting the database? Rendering partials?
All those are really easy to see, visually:
There’s another useful thing that a flamegraph can show you:
Do you see a bunch of spikes that are all about the same height, like this?
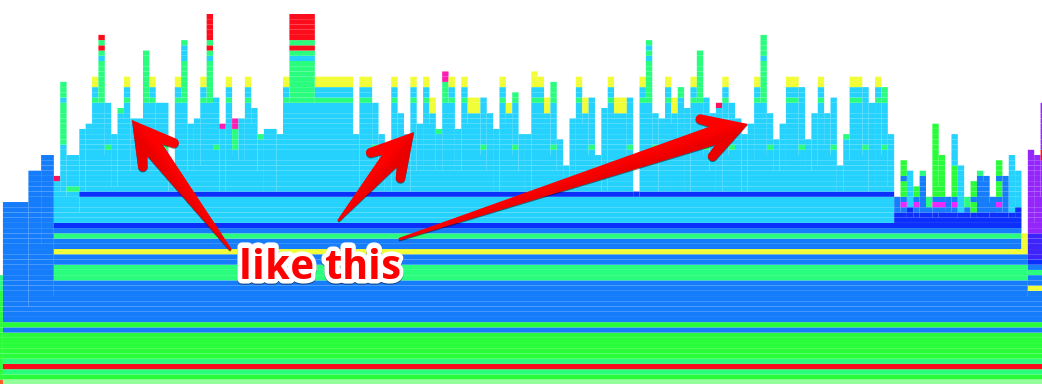
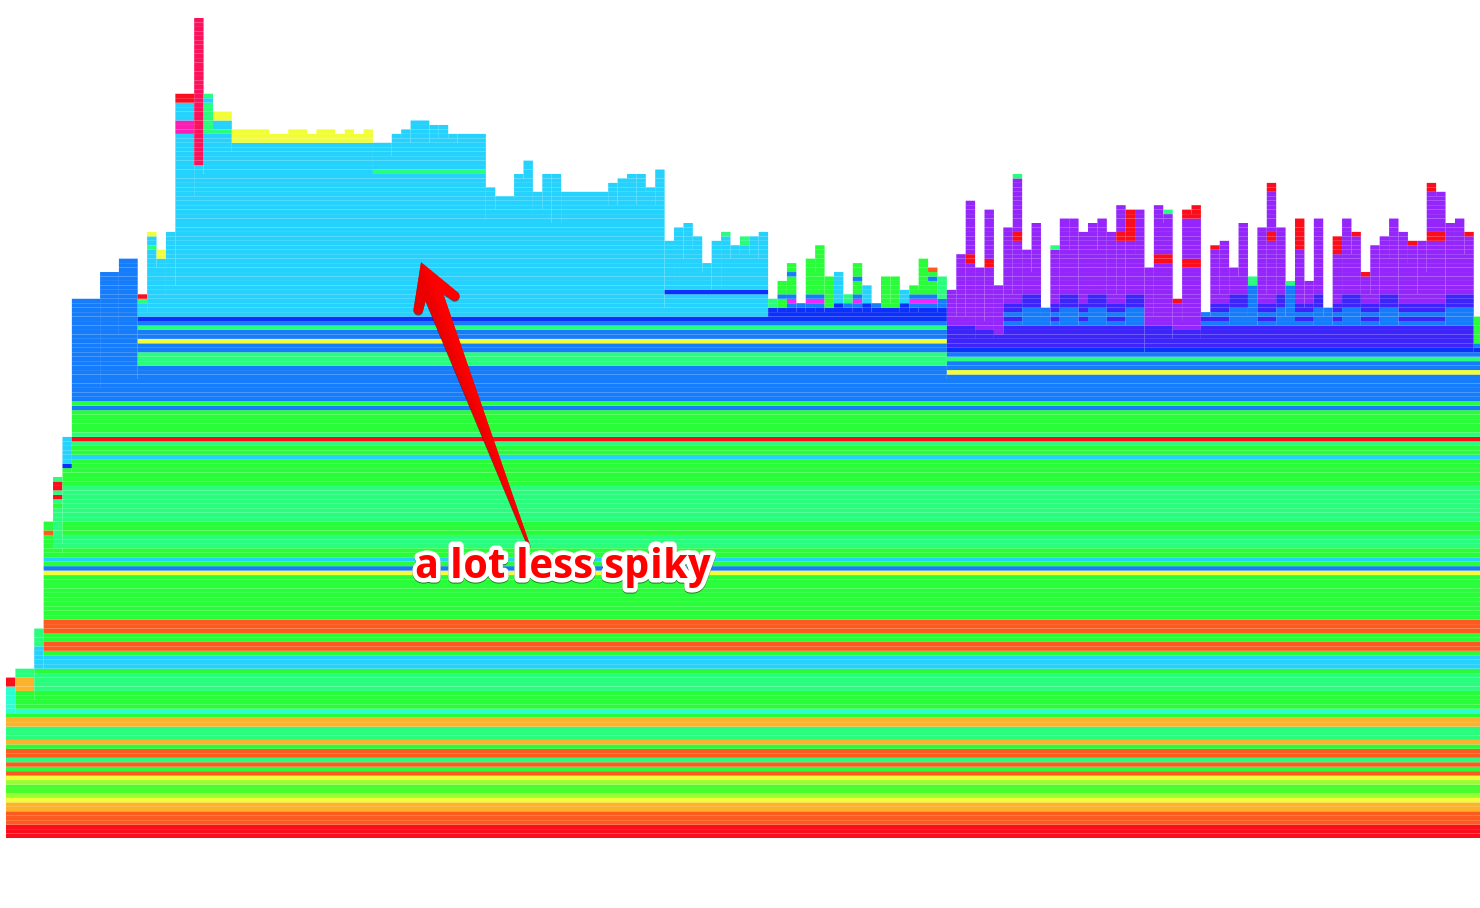
That often means you have some kind of N+1 query. You’re missing an includes somewhere, or making a bunch of calls to an API. If you added an includes, you’d get a flamegraph that looks more like this:
N+1 SQL queries are pretty easy to see with most performance tools: you just look for SQL calls that look similar. But non-SQL N+1 issues, like hitting an API too many times, are a lot harder to notice. Especially if your logging isn’t that great.
With flamegraphs, though, those problems are a lot more visible.
What not to pay attention to
Flamegraphs can be overwhelming. They show you a lot of information, and you’re pretty much forced to take it all in at once. So what can you ignore?
Usually, you can skip the bottom and top layers of the graph. Instead, I start exploring around the middle of the graph, or maybe 3/4 of the way to the top. That’s where my code tends to hang out.
The top of the graph is usually ActiveRecord- or IO-related, and the bottom is Rails framework code, so it makes sense that your code would be somewhere toward the middle.
Have you ever used a flamegraph? They’re a great way to find the best places to optimize. So give it a try! Add the rack-mini-profiler and flamegraph gems to your Gemfile. You’ll be surprised how much more insight you’ll get into your code.